

??
?????????????????????????????????????????????????????????????????????????????????????????????????????????????????????????
???????????????????????????????????????????????????????????????????????????????????????????????????????????????????????????????????????????????????????????????
??????Cytomegalovirus, CMV????????????????????????????????95%???????CMV????????????????????????????????????????????????????????????????????CMV???????????????????????????????????CMV?????????????
??????CMV????????????????T???????TCR?????????????????????
??
CMV??TCRs???
Fisher?????????????1????CMV??TCR???????????????????????????????????????????????Fisher?????p?????Fisher???????????????1???????????2?????????????
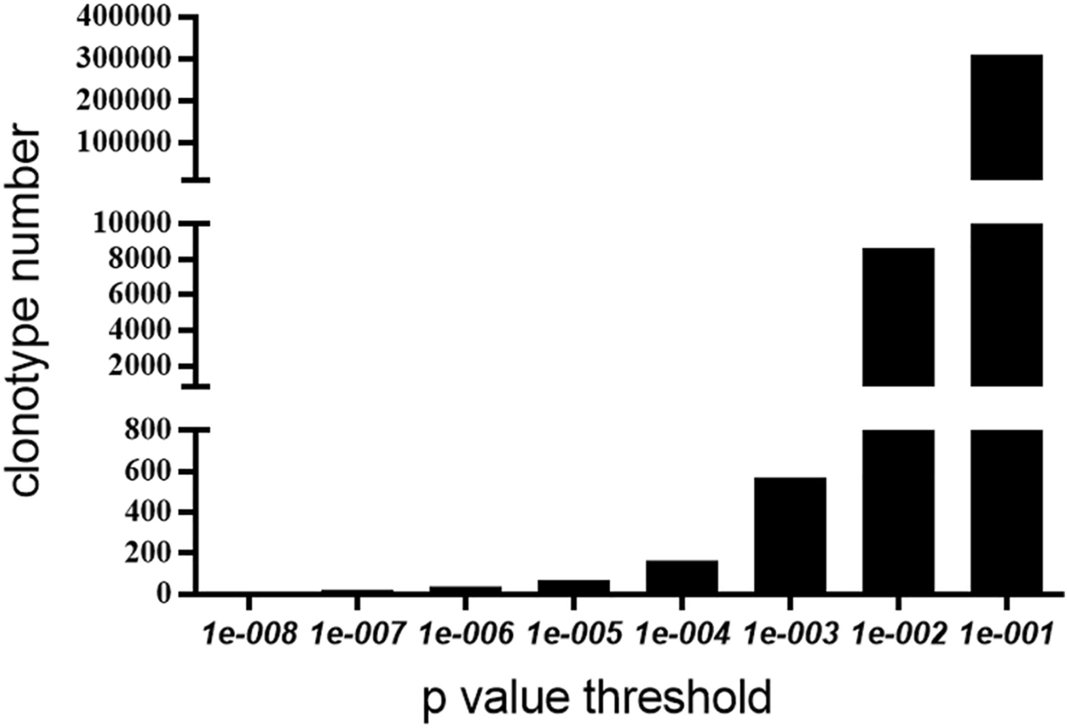
??
LDA?p????????10^-4?LR?SVM?RF?p????????10^-5
?2????????????????????????????????x???P???????y??????????????????????2a???LR logistic?????F1????????????????????????10^-4?10^-5?10^-6???????????????AUC???????????????????10^-3?10^-4?10^-5?AUC?????10^-4?AUC????FDR???????????????????10^-5?????????????????????????????????10^-4?????10^-5???2b??????SVM???F1????????????????????10^-4?10^-5?10^-6????????AUC??????????????????10^-4?10^-5?AUC????FDR????????????????????10^-5???????0.0851?SVM???????????????????????10^-4??????0.2609??2c????????RF??????????????????F1???AUC??????????????????????10^-4?10^-5?10^-6?????????????FDR??????????????????????????10^-3?10^-4?10^-5?10^-6???????2d???LDA???????F1???AUC??????????????10^-4?10^-5?10^-6???????????????10^-4???????????FDR?????????????????????10^-5??????
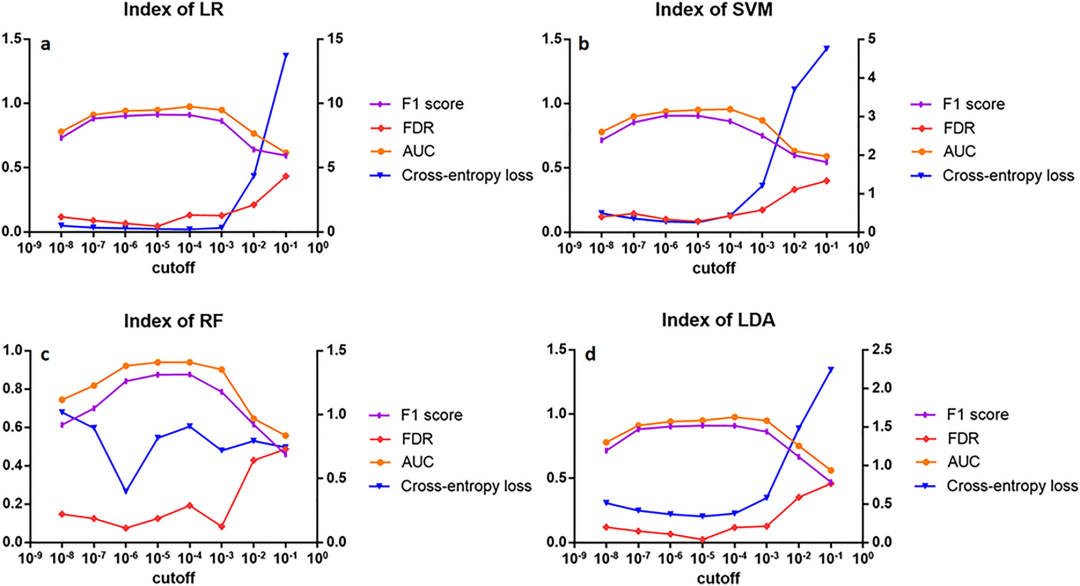
Figure 2.Evaluation metrics of algorithms. The scores of four algorithms of logistic regression (LR,a), support vector machine (SVM,b), random forest (RF,c), and linear discriminant analysis (LDA,d) were based on four evaluation metrics. The purple, red, orange, and blue curves represent the F1 score, FDR, AUC, and cross-entropy loss, respectively, with the first three indicators on the left Y-axis and the cross-entropy loss on the right Y-axis.
??
4????????
??3?????????????????????????????????????????3a?logistic????????????????????????????????????????????????3b?SVM?????????????????????????????????SVM??????????????????????????????????????3c????????????????????????????????????????????????????????3d????????????????LR????????????????????????????
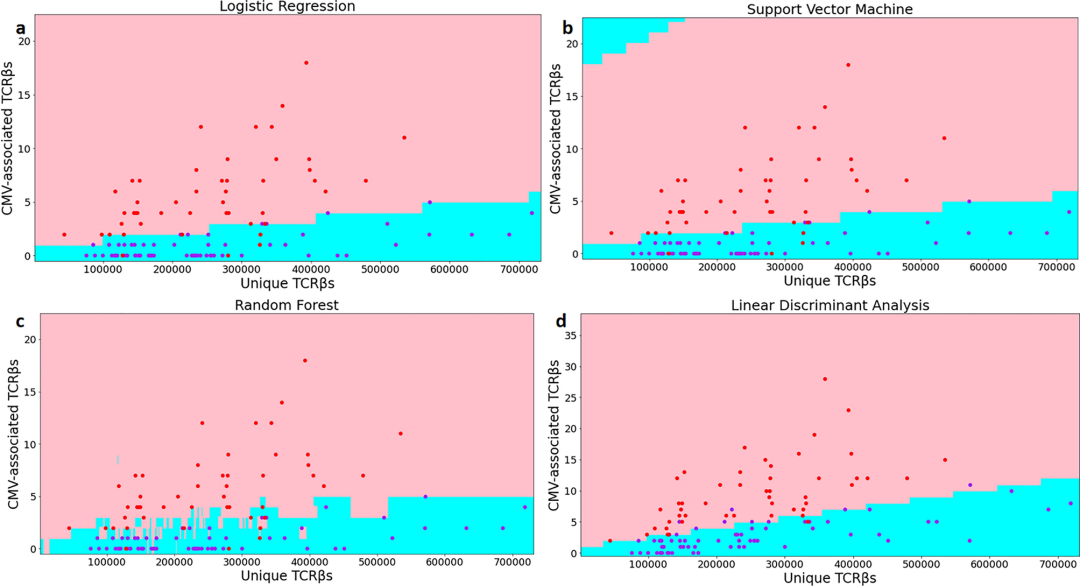
Figure 3.Scatter plots and area classification lines of testing samples. The figure depicts a scatter plot of positive and negative decision boundaries obtained by the four classification algorithms trained on cohort1 training samples and cohort2 test samples, where the x-axis represents the total number of TCR? sequence species per sample and the y-axis donates the number of repeat species with associated TCR sequences. The blue dots represent negative samples in cohort 2, and the red dots represent positive samples in cohort 2. The pink and sky blue regions represent the positive and negative regions obtained by training each algorithm’s cohort1 training data, respectively. Figure (a–d) shows the classification graph algorithms and the distribution of test sample points of the LR, SVM, RF and LDA, respectively.
??
?????????
????LDA?p????????10^-4?LR?SVM?RF?p????????10^-5???????????????4????????????????????????????????????x?????????????accuracy, sensitivity, specificity???LDA, LR, RF, SVM???????????????????????????????????????90%?????LR?LDA????????92.86%?SVM????91.96%?RF???????89.29%????????LDA???????95.83%??????????85% – 88%?????LDA?????????????????????????????LR?SVM?????????96.88%?????????????????????
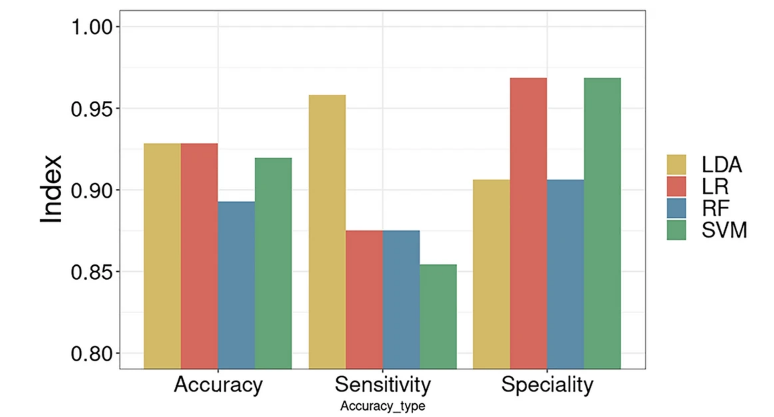
Figure 4.LDA and LR perform better on CMV data. Figure depicts the optimal performance of each algorithm corresponding to the optimal threshold value to obtain the accuracy, sensitivity and specificity of each algorithm.
??
????
??????????????????????????????????????????????????????????????????????????????????????????????????????????????????????????????????????????????????????????????AUC???????????????????????????
??
????
???????????????????????????????????TCR?????????????????????????????????????????????????????????????????????????????AUC?????????????????????????????????????90%???
??
???????????????????????TCR??CMV??TCR???CMV????????????AUC???????LDA???CMV????????????????????
????
Zhou, K., Huo, J., Gao, C. et al. Applying T-classifier, binary classifiers, upon high-throughput TCR sequencing output to identify cytomegalovirus exposure history. Sci Rep 13, 5024 (2023). https://doi.org/10.1038/s41598-023-31013-z
?????
?????????????????????????????????????????????????????????????????????????????????????
????????????????????????????????????????????????????????????????????????????????????????
ImmunoDiagnostics | ImmunoMonitoring ???? | ???? ??????????? ????????? ImmuHub | Seq-MRD | Seq-SHM Immun-Traq| Immun-Cheq Web?www.immuquad.com Email?Contact@immuquad.com Tel?0571-81061561 Address??????????196??????? 4??1?